Your step-by-step transition to a data and AI-driven
Glass Factory
HappyOps supports glass makers to evolve into digital factories, improving Pack-to-Melt and worker productivity, reducing setup times, error rates, and scrap.
Get the help you need
The challenges of glass production
Being among the most mechanized production lines in the world, glass factories deal with a lot of obstacles in their operations.
- Intricate setup processes
- In glass production, no setup process is the same. Workers need to make numerous adjustments when switching to new products – this lack of uniformity due to reliance on analog techniques increases costs and risks.
- Sustainability
- Lack of efficiency can lead to the waste of resources and time as well as scrap and high energy consumption. This not only results in increased costs but also in failed opportunities for promoting sustainability.
- Heterogeneous system and equipment
- Collecting data can be challenging, especially in environments with diverse glass manufacturing software systems and equipment. Nonetheless, gathering structured data over extended periods is the key to optimizing any glass factory.
- High dependency on experienced workers
- In the highly specialized glass manufacturing industry, the ability to depend on historical data and systematically enhance SOPs has gained immense importance, especially in the context of a growing skill-shortage.
Your journey to a digital metal factory
HappyOps guides you on your way to flexible and more efficient digital manufacturing operations, step by step.
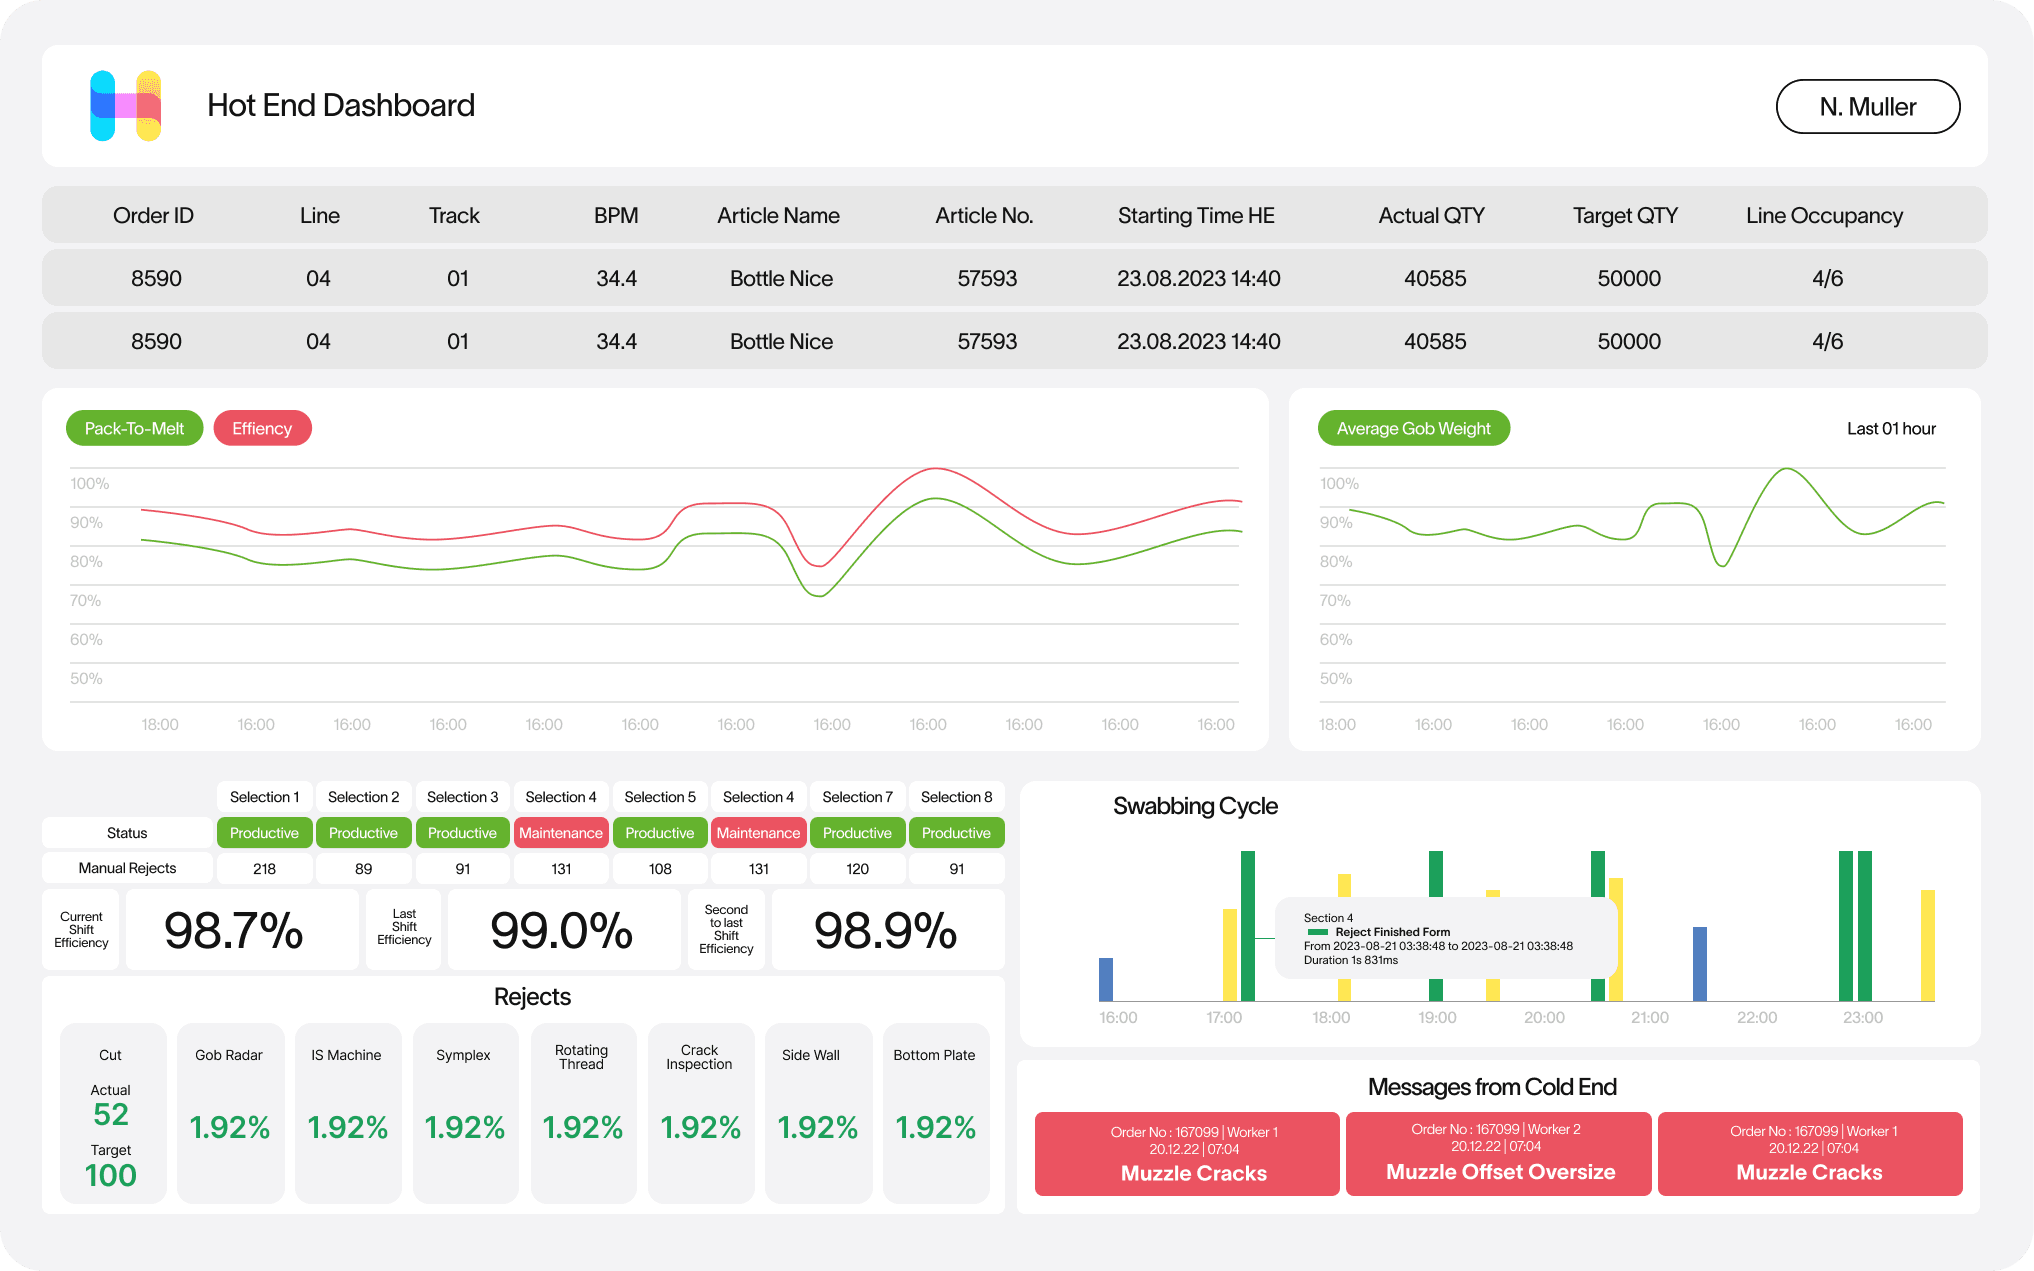
Hot End Dashboard
A live dashboard mounted in the Hot End area displays relevant data points from various parts of the line. It also showcases calculated KPIs, some of which are enhanced by AI, such as Efficiency, Pack-to-Melt, Pack-to-Cut, and more
Hot End Dashboard
A live dashboard mounted in the Hot End area displays relevant data points from various parts of the line. It also showcases calculated KPIs, some of which are enhanced by AI, such as Efficiency, Pack-to-Melt, Pack-to-Cut, and more
Hot End Dashboard
A live dashboard mounted in the Hot End area displays relevant data points from various parts of the line. It also showcases calculated KPIs, some of which are enhanced by AI, such as Efficiency, Pack-to-Melt, Pack-to-Cut, and more
Hot End Dashboard
A live dashboard mounted in the Hot End area displays relevant data points from various parts of the line. It also showcases calculated KPIs, some of which are enhanced by AI, such as Efficiency, Pack-to-Melt, Pack-to-Cut, and more
Hot End Dashboard
A live dashboard mounted in the Hot End area displays relevant data points from various parts of the line. It also showcases calculated KPIs, some of which are enhanced by AI, such as Efficiency, Pack-to-Melt, Pack-to-Cut, and more
Hot End Dashboard
A live dashboard mounted in the Hot End area displays relevant data points from various parts of the line. It also showcases calculated KPIs, some of which are enhanced by AI, such as Efficiency, Pack-to-Melt, Pack-to-Cut, and more